Tiiips app: ingredients detective.
Free from Play Store!


Tiiips app: ingredients detective.
Free from Play Store!
|
|
|
|
|
| Donate | App | Join | Log in |
|
|
|
|
|
| Donate | App | Join | Log in |
 | "Descrizione" by Al222 (18816 pt) | 2020-Mar-28 12:15 |
| Evaluation | N. Experts | Evaluation | N. Experts |
|---|---|---|---|
| 1 | 6 | ||
| 2 | 7 | ||
| 3 | 8 | ||
| 4 | 9 | ||
| 5 | 10 |
To better interpret the data and trend of Coronavirus COVID-19.
Day-to-day data provides an immediate view whose interpretation, in my opinion, can generate misleading predictions. I have analyzed the situation with the data every 5/7 days and the result seems more understandable to me.
Of all the graphs and methods I have used so far, the ones that follow and in particular the second and third ones give me more confidence in a decrease of contagion within 3/4 weeks.
The first two graphs concern Turin and Milan from 8/3/2020 to 26/3/2020. where it is observed that the trend has repeated wave oscillations every 5/7 days.
First graph: Percentage of increase in contagion on the previous day compared to the city's population. Turin and Milan.
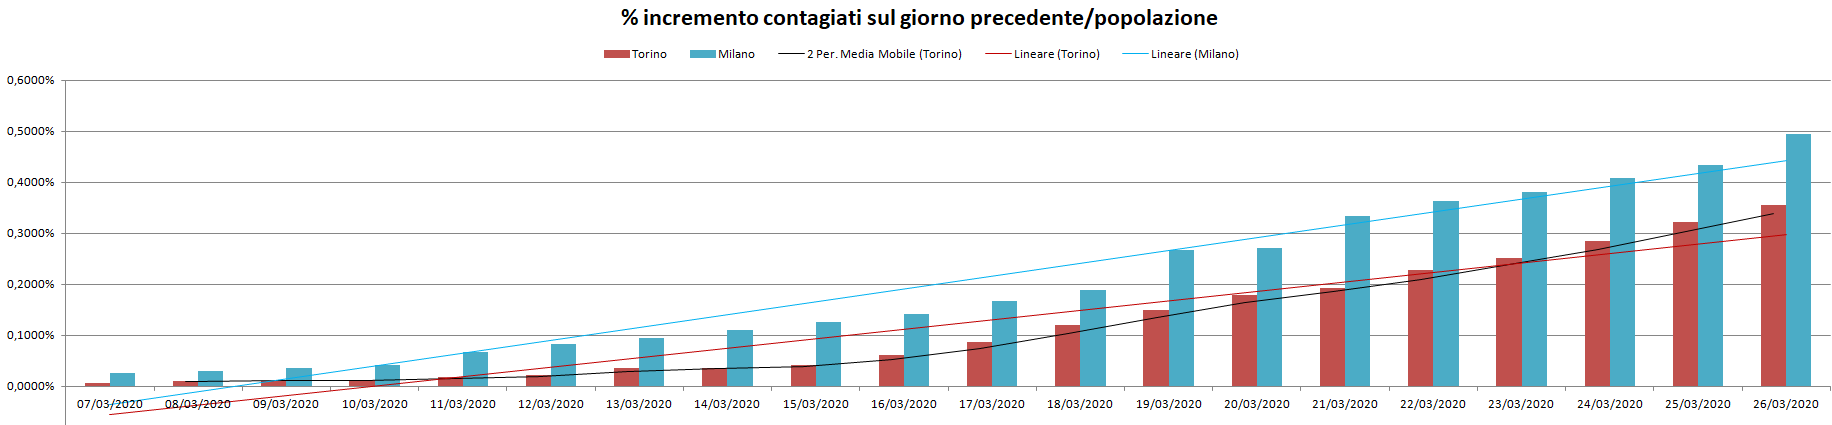
The growth line is unequivocal, but let's look at the other graphs.
Second graph: Percentage of infected people of the day compared to the population of the city. Turin and Milan.
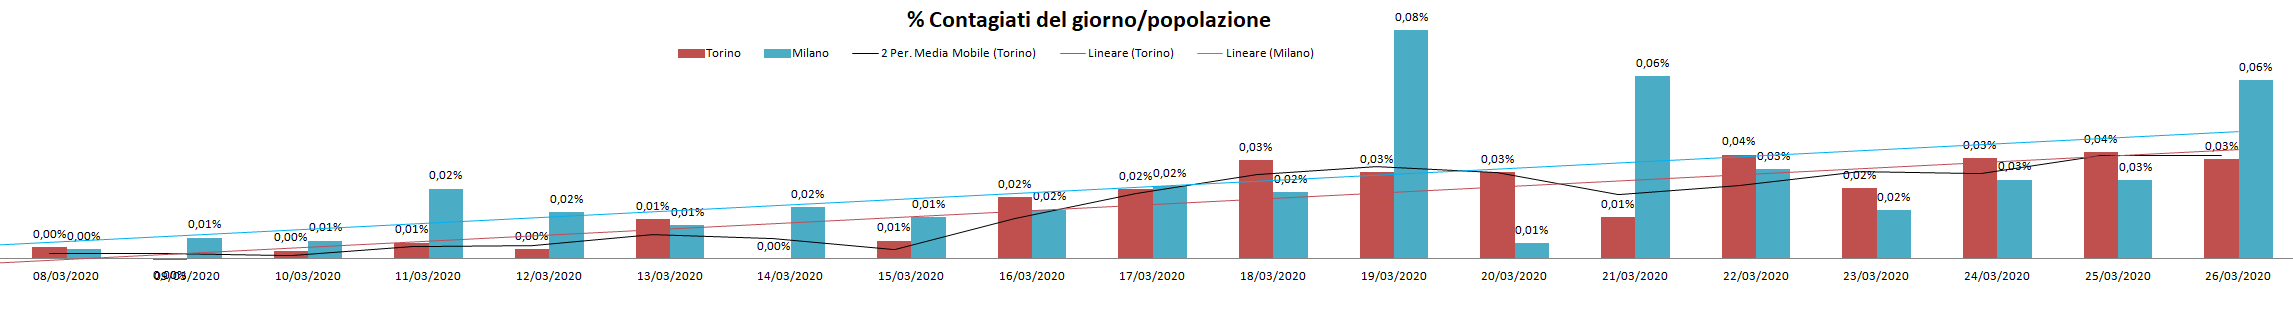
Surprise. The graph is very different and indicates that the trend has repeated wave oscillations every 5/7 days.
We now see a graph that, in addition to Turin and Milan, includes the most affected city, Bergamo.
Third graph: Percentage of infected people of the day compared to the population of the city. Turin, Milan and Bergamo.
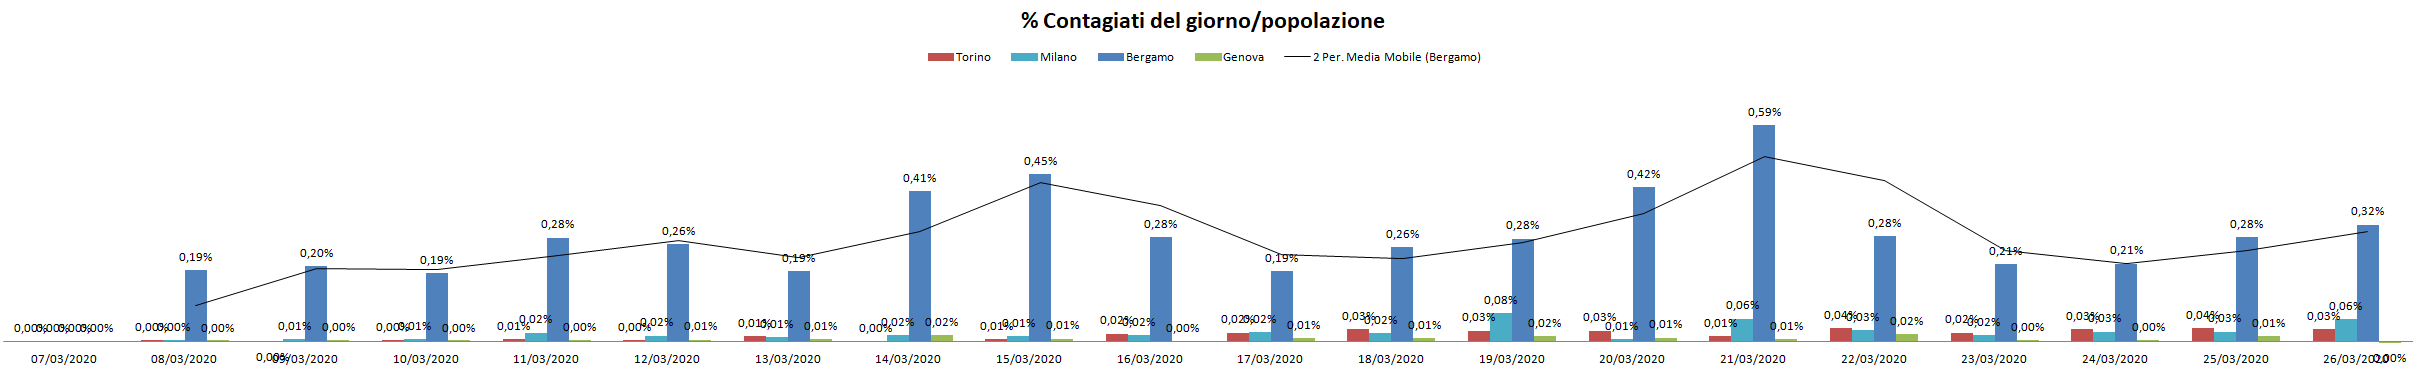
Also a surprise here. We have 3 waves with a fairly similar trend and it seems that the last one is losing strength.
| Evaluate |